Chart
You can make data into a graph to display data changes that will be instantly recognizable.
Inserting a chart
Perform the following to insert a chart.
- Select a range of data you want to make a chart.
- Click the Chart
 icon on the toolbox. Or click Insert-Chart.
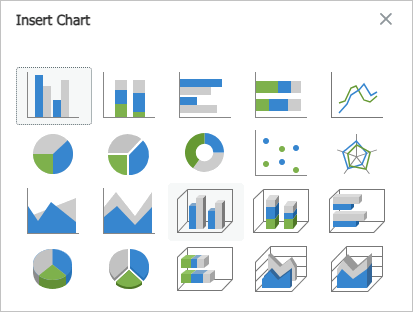
- Select the chart type on the Insert Chart dialog box.
Switching row/column
To set chart data direction by row or column, do the following:
- Select the chart you want to switch row/column data.
- In the Chart task pane at the right, click the Switch Row/Column
 icon.
icon.
Adding chart components
To add components to your chart such as data labels and gridlines, do the following:
- Select the chart you want to add components to.
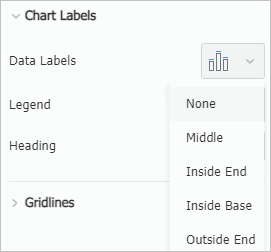
- In the Chart task pane at the right, click the
 icon of Data Labels under Chart Labels, and then select the location from the list.
- In the Chart task pane, click to select the Hozontal or Vertical gridlines icon you want to display under Gridlines.
See Also
Formula, Image, Chart (Task Pane)